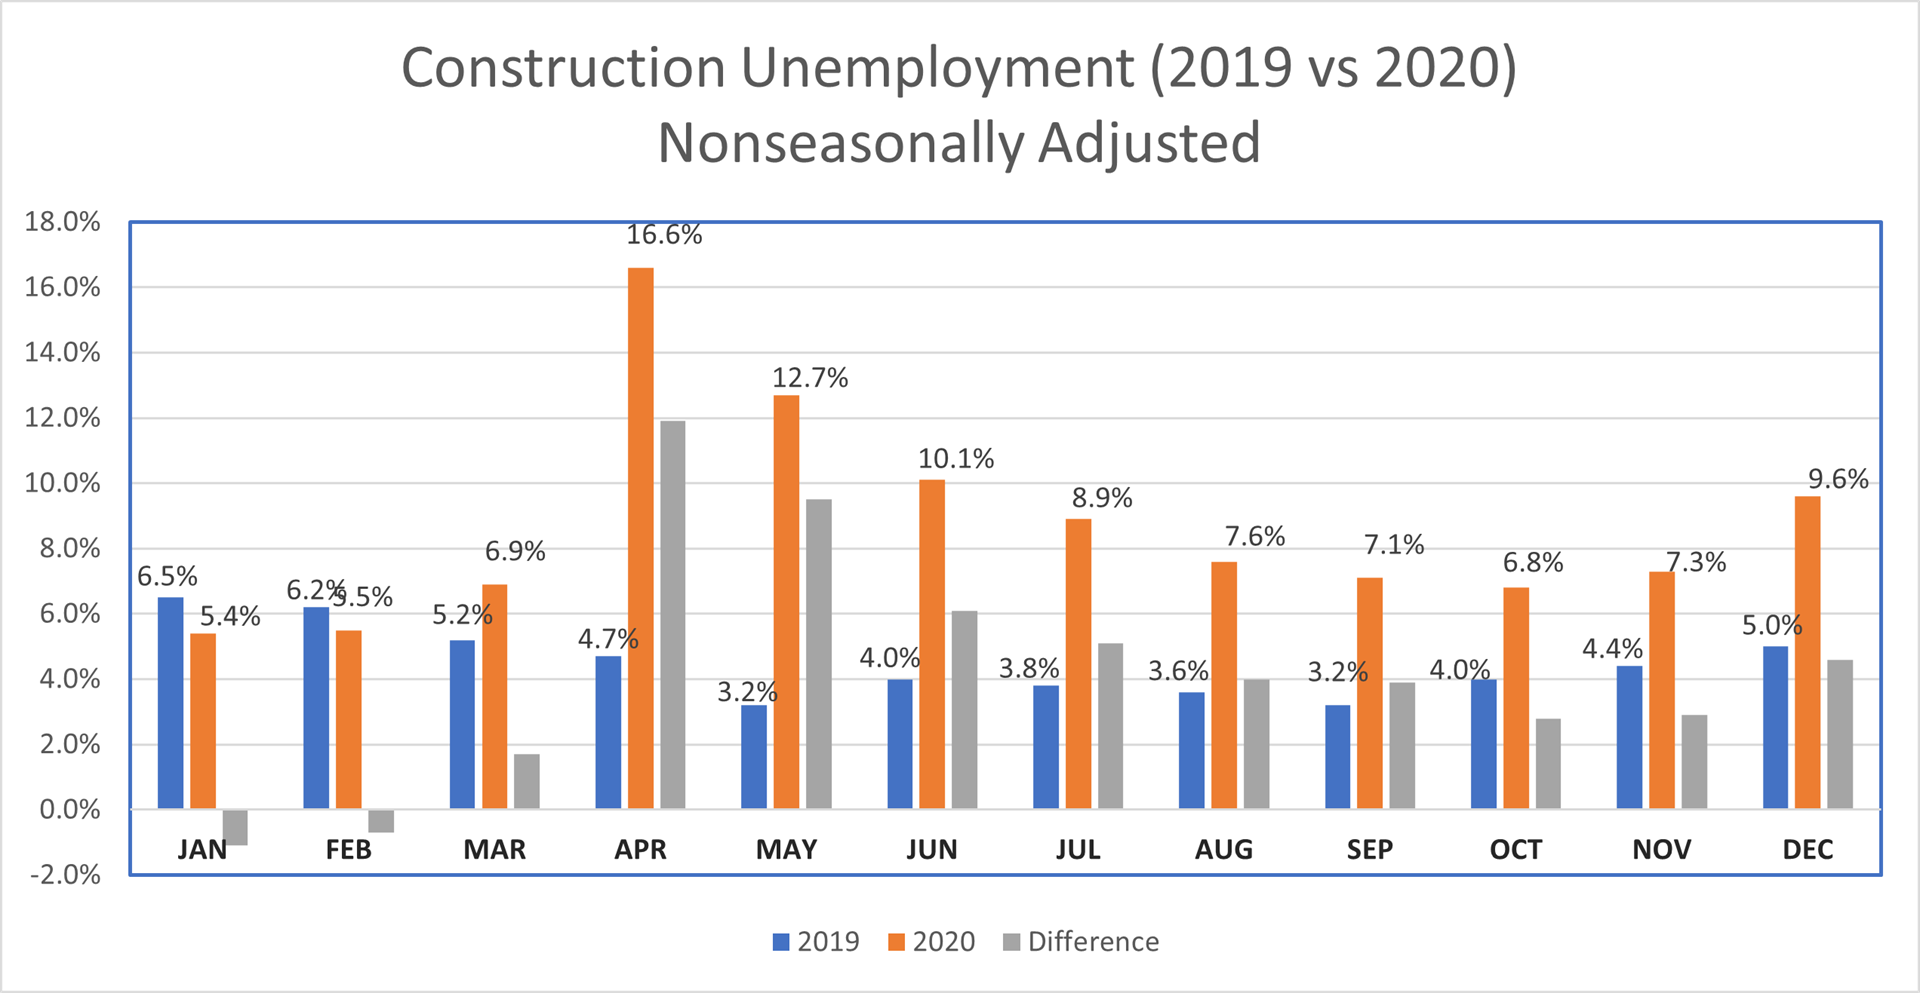
2019 Construction Employment/Unemployment vs. Overall Unemployment Statistics
|
|
Jan19
|
Feb19
|
Mar19
|
Apr19
|
May19
|
Jun19
|
|
Construction
Unemployment
|
638k
|
588k |
490k |
439k |
294k |
390k |
|
|
|
|
|
|
|
|
|
Percentage
|
6.4% |
6.2% |
5.2% |
4.7% |
3.2% |
4.0% |
|
|
|
|
|
|
|
|
|
Overall Unemployment
by Percentage
|
4.0% |
3.8% |
3.8% |
3.6% |
3.6% |
3.7% |
| |
|
|
|
|
|
|
| Participation Rate |
63.2% |
63.2% |
63.0% |
62.8% |
62.8%
|
62.9% |
|
|
Jul19
|
Aug19
|
Sep19
|
Oct19
|
Nov19
|
Dec19
|
|
Construction
Unemployment
|
386k |
361k
|
319k |
398K
|
428K
|
489K
|
|
|
|
|
|
|
|
|
|
Percentage
|
3.8% |
3.6%
|
3.2% |
4.0% |
4.4% |
5.0% |
|
|
|
|
|
|
|
|
| Overall Unemployment by Percentage |
3.7% |
3.7%
|
3.5% |
3.6% |
3.5% |
3.5%
|
| |
|
|
|
|
|
|
| Participation Rate |
63.0% |
63.2%
|
63.2% |
63.6% |
63.2% |
63.2%
|
2018 Construction Employment/Unemployment vs. Overall Unemployment Statistics
|
|
Jan18
|
Feb18
|
Mar18
|
Apr18
|
May18
|
Jun18
|
|
Construction
Unemployment
|
707
|
732
|
696 |
623 |
415 |
466
|
|
|
|
|
|
|
|
|
|
Percentage
|
7.3% |
7.8% |
7.4% |
6.5% |
4.4% |
4.7%
|
|
|
|
|
|
|
|
|
|
Overall Unemployment
by Percentage
|
4.1% |
4.1% |
4.1% |
3.9% |
3.8% |
4.0%
|
| |
|
|
|
|
|
|
| Participation Rate |
62.7% |
63.0% |
62.9% |
62.8% |
62.7% |
62.9%
|
|
|
Jul18
|
Aug18
|
Sep18
|
Oct18
|
Nov18
|
Dec18
|
|
Construction
Unemployment
|
333 |
328 |
412 |
352
|
375
|
493
|
|
|
|
|
|
|
|
|
|
Percentage
|
3.4% |
3.4% |
4.1% |
3.6% |
3.9% |
5.1% |
|
|
|
|
|
|
|
|
| Overall Unemployment by Percentage |
3.9% |
3.9% |
3.9% |
3.7% |
3.7% |
3.9% |
| |
|
|
|
|
|
|
| Participation Rate |
62.9% |
62.7% |
62.7% |
62.9% |
62.9% |
63.1% |
2017 Construction Employment/Unemployment vs. Overall Unemployment Statistics
|
|
Jan ‘17
|
Feb ‘17
|
Mar ‘17
|
Apr ‘17
|
May ‘17
|
Jun ‘17
|
|
Construction
Unemployment
|
859
|
781 |
764
|
585 |
502
|
430 |
|
|
|
|
|
|
|
|
|
Percentage
|
9.4%
|
8.8% |
8.4%
|
6.3%
|
5.3%
|
4.5%
|
|
|
|
|
|
|
|
|
|
Overall Unemployment
by Percentage
|
4.8% |
4.7% |
4.5%
|
4.4%
|
4.3%
|
4.4%
|
| |
|
|
|
|
|
|
| Participation Rate |
62.9% |
63.0% |
63.0%
|
62.9%
|
62.7%
|
62.8%
|
|
|
Jul ‘17
|
Aug ‘17
|
Sep ‘17
|
Oct ‘17
|
Nov ‘17
|
Dec ‘17
|
|
Construction
Unemployment
|
469 |
448
|
448
|
418
|
467
|
554
|
|
|
|
|
|
|
|
|
|
Percentage
|
4.9% |
4.7%
|
4.7%
|
4.5%
|
5.0%
|
5.9%
|
|
|
|
|
|
|
|
|
| Overall Unemployment by Percentage |
4.3% |
4.4%
|
4.2%
|
4.1%
|
4.1%
|
4.1%
|
| |
|
|
|
|
|
|
| Participation Rate |
62.9% |
62.9% |
63.1%
|
62.7% |
62.7% |
62.7%
|
Data Source: Table A-14, BLS, (figures are in 000s)
2016 Construction Employment/Unemployment vs. Overall Unemployment Statistics
|
|
Jan ‘16
|
Feb ‘16
|
Mar ‘16
|
Apr ‘16
|
May ‘16
|
Jun ‘16
|
|
Construction
Unemployment
|
729
|
749
|
768 |
530 |
461 |
417
|
|
|
|
|
|
|
|
|
|
Percentage
|
8.5%
|
8.7%
|
8.7%
|
6.0% |
5.2% |
4.6%
|
|
|
|
|
|
|
|
|
|
Overall Unemployment
by Percentage
|
4.9% |
4.9% |
5.0%
|
5.0%
|
4.7% |
4.9%
|
| |
|
|
|
|
|
|
| Participation Rate |
62.7% |
62.9% |
63.0%
|
62.8%
|
62.6%
|
62.7%
|
|
|
Jul ‘16
|
Aug ‘16
|
Sep ‘16
|
Oct ‘16
|
Nov ‘16
|
Dec ‘16
|
|
Construction
Unemployment
|
410 |
454
|
474
|
512
|
517
|
670
|
|
|
|
|
|
|
|
|
|
Percentage
|
4.5% |
5.1%
|
5.2%
|
5.7%
|
5.7%
|
7.4%
|
|
|
|
|
|
|
|
|
| Overall Unemployment by Percentage |
4.9%
|
4.9%
|
5.0%
|
4.9%
|
4.6%
|
4.7%
|
| |
|
|
|
|
|
|
| Participation Rate |
62.8% |
62.8% |
62.9% |
62.8% |
62.8% |
62.7% |
Data Source: Table A-14, BLS, (figures are in 000s)
2015 Construction Employment/Unemployment vs. Overall Unemployment Statistics
|
|
Jan ‘15
|
Feb ‘15
|
Mar ‘15
|
Apr ‘15
|
May ‘15
|
Jun ‘15
|
|
Construction
Unemployment
|
511
|
906 |
831 |
652
|
569 |
522 |
|
|
|
|
|
|
|
|
|
Percentage
|
9.8%
|
10.6%
|
9.5%
|
7.5%
|
6.7% |
6.3% |
|
|
|
|
|
|
|
|
|
Overall Unemployment
by Percentage
|
5.7% |
5.5%
|
5.5%
|
5.4%
|
5.5% |
5.3%
|
| |
|
|
|
|
|
|
| Participation Rate |
62.9% |
62.8% |
62.7% |
62.8% |
62.9% |
62.6% |
|
|
Jul ‘15
|
Aug ‘15
|
Sep ‘15
|
Oct ‘15
|
Nov ‘15
|
Dec ‘15
|
|
Construction
Unemployment
|
474
|
474
|
479
|
534
|
536
|
645
|
|
|
|
|
|
|
|
|
|
Percentage
|
5.5%
|
6.1%
|
5.5%
|
6.2%
|
6.2% |
7.5%
|
|
|
|
|
|
|
|
|
| Overall Unemployment by Percentage |
5.3% |
5.1% |
5.1% |
5.0% |
5.0% |
5.0% |
| |
|
|
|
|
|
|
| Participation Rate |
62.6% |
62.6% |
62.4% |
62.4% |
62.5% |
62.6% |
Data Source: Table A-14, BLS, (figures are in 000s)


